The new statistics in 5.0 use a monochrome pallet of blues to blend in with the muted tones of Lion. A few have asked for the bright colors of before. Since our programs are based on a number of open technologies, in this case HTML and CSS to render the statistics, the colors can be customized with a little CSS knowledge.
Open the program’s package: ctrl-click the program icon for a contextual menu to find “Show Package Contents”, then navigate to the /Contents/Frameworks/Pediabase.framework/Resources/statistics.html. This file contains the base for building the final statistics view. Open the file in a text editor to change the colors (TextEdit requires the use of the ‘Open’ command to select the “Ignore Rich Text” option, otherwise it opens looking like a web page).
At the top of the file there is a section of CSS that defines the colors:
.vertgraph ul li {
background: -webkit-gradient(linear, left top, left bottom, color-stop(0%,#A1B0CF), color-stop(100%,#788AB0));
}
.vertgraph ul .red {
background: -webkit-gradient(linear, left top, left bottom, color-stop(0%,#788AB0), color-stop(100%,#4f648c));
}
.vertgraph ul .green {
background: -webkit-gradient(linear, left top, left bottom, color-stop(0%,#4f648c), color-stop(100%,#263e6d));
}
.vertgraph ul .blue {
background: -webkit-gradient(linear, left top, left bottom, color-stop(0%,#263e6d), color-stop(100%,#00184e));
}
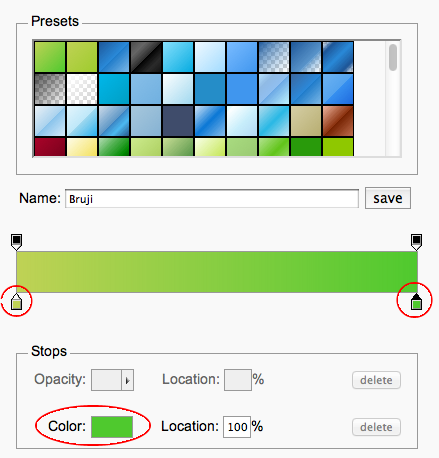
The color classes are still named after the old color scheme. What you want to change here are the odd looking hex values, “#263e6d”. The first one on each line represents the top color and the bottom color of the bar. To help select new colors and create a gradient you can use ColorZilla’s gradient editor a handy website that will let you pick a color from a palette and produce the bit of code that you need to copy.
Click on one of the stops on the bottom of the color bar, then click on the color well to change the color. Once you have established the color you would like to use for a bar, copy the -webkit-gradient declaration from the code on the left, the highlighted section and replace the above color:
Repeat four times for each color bar and save the file. You are all set now with new eye-popping colors for your statistics.
For simplicity here are similar colors to what we used to have with version 3 and 4 of the Pedias, so you can copy paste them directly into the template.
.vertgraph ul li {
background: -webkit-gradient(linear, left top, left bottom, color-stop(0%,#fcd83a), color-stop(100%,#febf04));
}
.vertgraph ul .red {
background: -webkit-gradient(linear, left top, left bottom, color-stop(0%,#ef4747), color-stop(100%,#c91414));
}
.vertgraph ul .green {
background: -webkit-gradient(linear, left top, left bottom, color-stop(0%,#139e0c), color-stop(100%,#075e0a));
}
.vertgraph ul .blue {
background: -webkit-gradient(linear, left top, left bottom, color-stop(0%,#4c90ff), color-stop(100%,#1938ff));
}
If you do change any of the colors be sure to make a copy of the statistics.html file outside of the program bundle. Since the file resides within the program it gets updated when you download a new version. With a copy of the file, you can drop it in as a replacement to set your custom colors again.


